Nova Leap Health Corp. Posts Best Financial Performance in Company History with Record Q3 2025 Results
NOT FOR DISSEMINATION IN THE UNITED STATES OR FOR DISTRIBUTION TO U.S. NEWSWIRE SERVICES
HALIFAX, Nova Scotia, Nov. 06, 2025 (GLOBE NEWSWIRE) -- NOVA LEAP HEALTH CORP. (TSXV: NLH) (“Nova Leap” or “the Company”), a growing home health care organization, is pleased to announce the release of record financial results for the quarter ended September 30, 2025. All amounts are in United States dollars unless otherwise specified.
During the quarter, Nova Leap achieved the following record results:
- Record consolidated quarterly revenues;
- Record consolidated gross margin;
- Record consolidated Adjusted EBITDA;
- Record Canadian operating segment revenues;
- Record Canadian operating segment gross margin;
- Record Canadian operating segment Adjusted EBITDA;
- Record U.S. operating segment revenues;
- Record U.S. operating segment gross margin; and
- Record U.S. operating segment Adjusted EBITDA.
Nova Leap Q3 2025 Financial Results
Financial results for the third quarter ended September 30, 2025 include the following:
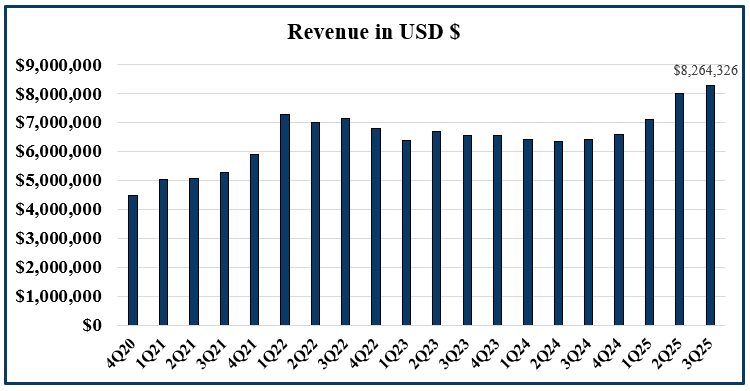
- Q3 2025 revenues of $8,264,326 increased by 3% relative to Q2 2025 revenues of $8,021,072 and 29% relative to Q3 2024 revenues of $6,406,528.
- Q3 2025 Adjusted EBITDA of $670,706 was an increase of 16.1% over Q2 2025 Adjusted EBITDA of $577,907 and 76.9% over Q3 2024 Adjusted EBITDA of $379,116 (see calculation of Adjusted EBITDA below).

- Gross profit margin as a percentage of revenues remained strong at 39.6% in Q3 2025. Gross profit margin percentage was 40.2% in Q2 2025 and 38.0% in Q3 2024.
- The Company generated income from operating activities in Q3 2025 of $418,553, an increase of $68,114 from Q2 2025 and $210,443 from Q3 2024.
- The Company recorded net income of $426,171 in Q3 2025 as compared to a net loss of $484,008 in Q2 2025 and a net loss of $207,871 in Q3 2024.
- The Company had available cash of $1,571,716 as of September 30, 2025 as well as full access to the unutilized revolving credit facility of $1,077,509 (CAD$1,500,000).
- The Company had total demand loans and promissory notes outstanding as of September 30, 2025 of $2,300,800, representing a leverage ratio of 1.18 times to trailing twelve month Adjusted EBITDA for the period from October 1, 2024 to September 30, 2025 of $1,950,620.
- As of the current date, the Company has access up to $4,691,000 in available credit for business acquisitions through its existing credit agreement to support its long-term growth strategy.
President & CEO’s Comments
“Q3 was another record-breaking quarter for Nova Leap,” said Chris Dobbin, President & CEO. “Following the strongest results in our history last quarter, we delivered new highs again in Q3, setting nine financial records, including record consolidated revenues, gross margin, and Adjusted EBITDA. These results reflect consistent execution, operational discipline, and the strength of our team across North America. The momentum across our operations is both real and measurable.
From Q2 2023 through Q1 2025, Nova Leap averaged just over $400,000 in quarterly Adjusted EBITDA. That benchmark has now been materially reset. With Adjusted EBITDA of $578,000 in Q2 and $671,000 in Q3, we have established a new level of performance materially higher than before. The results speak for themselves — our model is scaling, margins are expanding, operating leverage is becoming evident and performance has reached record levels. Adjusted EBITDA for the first nine months of 2025 nearly equals our total for all of 2024, underscoring the strength and sustainability of this year’s performance.
Behind these record results are dedicated caregivers and team members who deliver exceptional service and uphold our mission every day. Their professionalism and commitment to excellence remain the foundation of our success.
Insider ownership increased again this quarter, reinforcing our confidence and alignment with shareholders. We know what we are building, and we have invested accordingly. We remain focused on disciplined growth, profitability, and long-term value creation.
Our balance sheet remains strong, with access to approximately $4.7 million in acquisition financing under our existing credit facility. Nova Leap continues to generate positive operating cash flow each quarter, as we have for the past three years. That gives us room to grow — on our terms — as we continue to pursue accretive opportunities while maintaining a disciplined, non-dilutive approach to expansion.”
This news release should be read in conjunction with the Unaudited Condensed Interim Consolidated Financial Statements for the three and nine months ended September 30, 2025 and 2024 including the notes to the financial statements and Management's Discussion and Analysis dated November 6, 2025, which have been filed on SEDAR+.
About Nova Leap
Nova Leap is an acquisitive home health care services company operating in one of the fastest-growing industries in the U.S. & Canada. The Company performs a vital role within the continuum of care with an individual and family centered focus, particularly those requiring dementia care. Nova Leap achieved the #42 ranking on the 2021 Report on Business ranking of Canada’s Top Growing Companies, the #2 ranking on the 2020 Report on Business ranking of Canada’s Top Growing Companies and the #10 Ranking in the 2019 TSX Venture 50™ in the Clean Technology & Life Sciences sector. The Company is geographically diversified with operations in the New England, Southeastern, South Central and Midwest regions of the United States as well as in Nova Scotia, Canada.
NON-IFRS AND OTHER MEASURES:
This release contains references to certain measures that do not have a standardized meaning under IFRS as prescribed by the International Accounting Standards Board (“IASB”) and are therefore unlikely to be comparable to similar measures presented by other companies. Rather, these measures are provided as additional information to complement IFRS measures by providing a further understanding of operations from management’s perspective. Accordingly, non-IFRS financial measures should not be considered in isolation or as a substitute for analysis of financial information reported under IFRS. The Company presents non-IFRS financial measures, specifically Adjusted EBITDA (as such term is hereinafter defined), as well as supplementary financial measures such as annualized revenue and annualized adjusted EBITDA. The Company believes these non-IFRS financial measures are frequently used by lenders, securities analysts, investors and other interested parties as a measure of financial performance, and it is therefore helpful to provide supplemental measures of operating performance and thus highlight trends that may not otherwise be apparent when relying solely on IFRS financial measures.
Adjusted Earnings before interest, taxes, amortization and depreciation (“Adjusted EBITDA”), is calculated as income from operating activities plus amortization and depreciation and stock-based compensation expense. The most directly comparable IFRS measure is income from operating activities.
The reconciliation of Adjusted EBITDA to the income from operating activities is as follows:
|
Q3 2025 $ |
Q2 2025 $ |
Q3 2024 $ |
|
| Income from operating activities | 418,553 | 350,439 | 208,110 |
| Amortization and depreciation | 233,427 | 208,890 | 146,169 |
| Stock-based compensation | 18,726 | 18,578 | 24,837 |
| Adjusted EBITDA | 670,706 | 577,907 | 379,116 |
FORWARD LOOKING INFORMATION:
Certain information in this press release may contain forward-looking statements, such as statements regarding future expansions and cost savings and plans regarding future acquisitions and business growth, including anticipated revenues growth, annualized revenue or annualized recurring revenue run rate growth and anticipated consolidated Adjusted EBITDA margins. This information is based on current expectations and assumptions, including assumptions described elsewhere in this release and those concerning general economic and market conditions, availability of working capital necessary for conducting Nova Leap’s operations, availability of desirable acquisition targets and financing to fund such acquisitions, and Nova Leap’s ability to integrate its acquired businesses and maintain previously achieved service hour and revenue levels, that are subject to significant risks and uncertainties that are difficult to predict. Actual results might differ materially from results suggested in any forward-looking statements. All forward-looking statements, including any financial outlook or future-oriented financial information, contained in this press release are made as of the date of this release and included for the purpose of providing information about management's current expectations and plans relating to the future, and these statements may not be appropriate for other purposes. The Company assumes no obligation to update the forward-looking statements, or to update the reasons why actual results could differ from those reflected in the forward-looking statements unless and until required by securities laws applicable to the Company. Additional information identifying risks and uncertainties is contained in the Company's filings with the Canadian securities regulators, which filings are available at www.sedarplus.com.
CAUTIONARY STATEMENT:
Neither TSX Venture Exchange nor its Regulation Services Provider (as that term is defined in the policies of the TSX Venture Exchange) accepts responsibility for the adequacy or accuracy of this release.
Photos accompanying this announcement are available at:
https://www.globenewswire.com/NewsRoom/AttachmentNg/71bd9f76-6412-43aa-b067-75ff146d79cc
https://www.globenewswire.com/NewsRoom/AttachmentNg/b6e02544-dd48-434e-b0d2-457e54e14b2c

For further information:

Chris Dobbin, CPA, ICD.D
Director, President and CEO
T: 902 401 9480
E:cdobbin@novaleaphealth.com
![]()
Revenue in USD $

Revenue in USD $
Adjusted EBITDA & Operating Income (Loss) in USD $
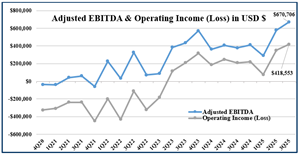
Adjusted EBITDA & Operating Income (Loss) in USD $
Legal Disclaimer:
EIN Presswire provides this news content "as is" without warranty of any kind. We do not accept any responsibility or liability for the accuracy, content, images, videos, licenses, completeness, legality, or reliability of the information contained in this article. If you have any complaints or copyright issues related to this article, kindly contact the author above.
